Canadians: Environment Canada Weather Forecasts

123

Senior Member
I've developed an enhancement to my HA app that reads weather data from Environment Canada's XML data feed (not their RSS feed). Many existing apps "screenscape" the data from EnviroCan's actual web-site, as opposed to the XML feed, and put themselves at the mercy of web-site redesigns.

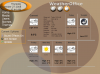
Unfortunately, EnviroCan's XML feed lacks something important found in feeds from other services, like The Weather Channel and NOAA, namely what icon should be used to graphically depict the weather. The 5-day forecast at www.weatheroffice.gc.ca shows icons for each day but the XML feed doesn't provide this information.

I've sent requests to both EnviroCan and the CBC (their weather data comes from EnviroCan) asking for whatever lookup table they use to associate an icon to a forecast. No replies yet ...

I don't suppose someone has gone through this exercise and has a lookup table showing the icon code to be used for a given abbreviated forecast? The worst part is that a single forecast can be represented by more than one icon. I've seen "Showers" represented by three difference icons ... no clue what the subtle difference was each day that forced the selection of a slightly different icon.
 
Have you tried Yahoo's weather service? They support coders, offer an XML feed, and include the icon info. This is assuming that they have data for Canada.
 
I omitted Yahoo's weather feed because it is based on data furnished by The Weather Channel. I'm currently using a weather plugin that sources its data from TWC (thanks to "John in VA"). TWC provides weather forecasts for Canadian cities, like Montreal, but I've found them to be less accurate than Environment Canada.

TWC's data is collected from a small airport a few kilometers south of the island of Montreal (St. Hubert). EnviroCan collects their data from the international airport located on the island (and closer to where I live). That may explain why the forecasts differ.

There are many useful parameters in TWC's weather feed. Unfortunately, many of them are unavailable for Montreal; I'll take a guess that not all data is collected for non-US cities.

Additional advantages of EnviroCan's feed are Weather Watches and Weather Warnings. I haven't seen this feature in TWC's documentation. EnviroCan's sole sore point is the lack of a "weather icon code".

BTW, Yahoo's weather data may come from TWC but their XML format is completely different. I found it to be more verbose than TWC and easier to read. It's a good choice for anyone who plans to create a weather plugin (for US cities).
 
As this is a back-burner project for me, I don't have much to contribute at the moment, but would be interested in your progress.

I have wondered, though, just how much forecast detail you can express in one icon. Attempting to be quick weather indicators, they are just soooo obscure sometimes. Naturally, this may be different when you live with them every day.

Having said that, you probably have seen this great collection. I have captured these for a future application.
http://www.nordicweather.net/index.php?sivu=90&lang=en

The mapping from abbreviated forecast to the associated icon, of course, is still the challenge.
 
Lagerhead,
Thanks for the link! I've never seen a comparative collection of weather icons. It makes you appreciate the craft of developing icons. It reminds me of fonts; artistry and science working together.

The animated set from Meteo Consult is interesting because it visually conveys the amount of precipitation ... it recreates the actual conditions. Given a page full of images, we tend to look at whatever is moving first; more information is conveyed through motion. Of course, seeing all of them animated at once is a bit overwhelming!

Personally, I find the photographic-quality icons the most difficult to interpret quickly. You'd think the opposite would be true but a simple pictogram of a cloud with vertical lines beneath it (or teardrops) conveys the concept of "rain" better than a real photo, especially if the photo is 50x50 pixels.

The CBC (Canadian Broadcasting Corporation) created a highly stylized version of Environment Canada's icons. They're not represented in the web-site's collection but well worth a look (sample below). My app adopts the CBC's layout and shows an icon with a caption.

One problem I've encountered is that not all icons are designed with transparent backgrounds ... so you get little rectangles with (typically) white backgrounds. EnviroCan's icons are built this way. I haven't figured out an easy way to change an icon's background from white to transparent without deteriorating the icon's outline (I've used paint.net). If there are any graphics artists reading this, I'd appreciate a few tips.

I'll probably create a cross-reference table containing abbreviated forecasts and corresponding icons. The tricky part is that EnviroCan uses more than one icon for the same forecast. Instead of a simple one-to-one relationship, the selection may depend on additional factors like the amount of precipitation. So "Showers" can be one of three icons depending on the amount of rainfall or maybe the probability of precipitation. I've been monitoring their forecasts (more closely than usual) in an attempt to learn the algorithm they use. So much simpler if they indicated the icon number in their XML feed! Worst case, I'll have to screenscrape their web-site.
 

Attachments

  • Rain.gif
    Rain.gif
    2.1 KB · Views: 7
FWIW, I received a reply from the good folks at Environment Canada. The forecasts and associated icons are generated by an internal application that bases its decision on, among many other things, the duration of certain weather events. The rules are complex, embedded within the application, and not easy to share. As a result, there is no direct one-to-one mapping available to the public.

Whereas I can base some decisions on POP and accumulation, duration of events is not available in the XML feed. Fortunately, all of the possible Abbreviated Forecasts and Conditions are defined (there are approximately 350 unique forecasts that use about 44 different icons). I've created a table and associated an icon based on 'best guess'. For example, anything with the word "showers" gets the "light rain" icon, forecasts including "flurries" get the "light snow" icon, etc. It won't be as visually accurate as EnviroCan's site where I've seen them use five different icons for "Showers" plus a sixth one for showers at night. The final result is still highly informative because the abbreviated forecast appears beneath each icon.

The attached image shows the pre-release version using the Space theme. Next step is to add either popups or tabs to show the detailed weather forecast (text version), historical almanac, and weather maps.
 

Attachments

  • WeatherOffice.png
    WeatherOffice.png
    83.9 KB · Views: 53
Could you post your mapping table?

Also, does Environment Canada define a maximum interval that you can hit their xml feed? i.e. do they mind if you hit it once an hour?
 
I haven't seen any documentation that restricts the polling frequency. I think an hourly check is reasonable; they update their forecast hourly. Each XML file contains the terms of use.

The mapping file will be included with the release of the WeatherOffice module.
 
Back
Top