Had a big storm this weekend and my Spectrum internet is only sort of working. Called them and they said they saw issues with my connection and scheduled a tech visit. What's strange is when I do a speed test I get about 85 Mbps. Not the advertised rate but plenty for me and shouldn't cause an issue. Sometimes sites work and sometimes I get a cannot connect the site must be down type message. I did a tracert (in windows command line) and got poor results - several timeouts and times up to 45 ms per line and about 15 lines. Need to do that when it's working well to have a comparison. nslookup seemed to work well but I only tried a couple of times. ping to weather.com (just a random site I picked) gave "destination unreachable". I would like to set up an automated test of the network that would tell me when things are degrading so I can call before it gets too bad. Probably would do that on a linux box that is on 24/7.
You are using an out of date browser. It may not display this or other websites correctly.
You should upgrade or use an alternative browser.
You should upgrade or use an alternative browser.
How to monitor quality of internet connection?
- Thread starter JimS
- Start date
-
- Tags
- internet monitoring pfsense
pete_c
Guru
Local infrastructure here and there (house two) is identical
ISP Cable ==> Arris SB8200 ==> PFSense ==>
Ruckus WAPs (X2)
Managed switches (combo POE, L2-L3 and L2)
Multimedia is all wired Gb
All of the above is on UPS's.
The PFSense dashboard will offer you some good stats.
RTT
The round-trip time of the most recent gateway monitoring probes.
RTTsd
The standard deviation of the round-trip time of recent gateway monitoring probes. This indicates how much variance there is between the fastest and slowest recent responses from the monitoring address.
A high value in this column indicates that the latency on the path to the monitor IP address varies significantly, with large differences between the high and low values. This could be due to load or instability on the link, for example.
A low value indicates that the latency on the circuit is consistent, which can mean it is in good condition, has a light load, or is otherwise operating optimally.
When I first complained it was this:

It is now this but still double what house two is.

House one used to be 1/2 of what you see above. This increase in RTT happened after some local area infrastructure work not relating to my local transport. I opened a ticket with XFinity relating to the above. They initially wrote after doing infrastructure work and asked if everything was OK. I said no. After checking my infrastructure and finding nothing wrong they admitted to issues of congestion. My speeds have not changed and they are the same as before. (~ 500 MBs)
DSL Reports has some offers some tools for testing over periods of time. To best use the DSL reports tools you much sign up as a member.

ISP Cable ==> Arris SB8200 ==> PFSense ==>
Ruckus WAPs (X2)
Managed switches (combo POE, L2-L3 and L2)
Multimedia is all wired Gb
All of the above is on UPS's.
The PFSense dashboard will offer you some good stats.
RTT
The round-trip time of the most recent gateway monitoring probes.
RTTsd
The standard deviation of the round-trip time of recent gateway monitoring probes. This indicates how much variance there is between the fastest and slowest recent responses from the monitoring address.
A high value in this column indicates that the latency on the path to the monitor IP address varies significantly, with large differences between the high and low values. This could be due to load or instability on the link, for example.
A low value indicates that the latency on the circuit is consistent, which can mean it is in good condition, has a light load, or is otherwise operating optimally.
When I first complained it was this:

It is now this but still double what house two is.

House one used to be 1/2 of what you see above. This increase in RTT happened after some local area infrastructure work not relating to my local transport. I opened a ticket with XFinity relating to the above. They initially wrote after doing infrastructure work and asked if everything was OK. I said no. After checking my infrastructure and finding nothing wrong they admitted to issues of congestion. My speeds have not changed and they are the same as before. (~ 500 MBs)
DSL Reports has some offers some tools for testing over periods of time. To best use the DSL reports tools you much sign up as a member.

Last edited:
pete_c
Guru
Create a widget on the dashboard to see these values when you log in to PFSense.
Those specs are good. You do have to refresh the page as the RTT numbers are dynamic.
When I had issues I would see values change every few seconds. You can graph these values if you want.
My cable connection goes directly to the modem as I do not have any TV services with cable.
Personally I would suggest not to use any of the ISP's DNS servers (configured in PFSense).
Read this: DNS Hijacking
Next log on to DSL Reports and do some long term testing (days). Nothing is required but your Internet address.
Are you using a cable modem? What MFG is it?
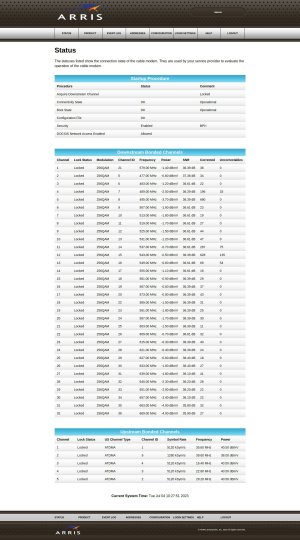
If it is a Motorola or Arris modem you can see some diagnostic data going to modem at IP 192.168.100.1
Arris SB8200 cable signal levels

not sure I can access the Spectrum modem and if I could from what I have read it's very limited what I can see. I tried several addresses with no luck. It's got spectrum name molded into the side and no other name visible. Model is E31U2V1. I have read that Spectrum allows people to use their own modem and some people do that so they have more control and access.
pete_c
Guru
Not an issue. The Spectrum techs can see this on your modem. (or google for diagnostics).
Just did that and see that Spectrum blocked access to the modem diagnostics...
Personally here have always used Motorola SB modems and lately Arris SB modems from the start of cable internet.
Use PFSense diagnostics to do pings and trace routes from either the LAN or WAN IPv4 or IPv6 interface. Works nicely.
Try the DSL Reports tools for long term testing on your Internet IP address.
Last edited:
Wouldn't be surprised if you're still dealing with backend issues due to damage caused by this storm. Call their support #, it usually will tell you if there's a known outage in the area once you go through their initial menu, or have them run a diagnostics on the modem.Had a big storm this weekend and my Spectrum internet is only sort of working. Called them and they said they saw issues with my connection and scheduled a tech visit. What's strange is when I do a speed test I get about 85 Mbps. Not the advertised rate but plenty for me and shouldn't cause an issue. Sometimes sites work and sometimes I get a cannot connect the site must be down type message. I did a tracert (in windows command line) and got poor results - several timeouts and times up to 45 ms per line and about 15 lines. Need to do that when it's working well to have a comparison. nslookup seemed to work well but I only tried a couple of times. ping to weather.com (just a random site I picked) gave "destination unreachable". I would like to set up an automated test of the network that would tell me when things are degrading so I can call before it gets too bad. Probably would do that on a linux box that is on 24/7.
Spectrum modems used to be accessible via http://192.168.100.1/, but Spectrum won't give you access depending on the make & model, but worth a shot. They claim if I go swap modems with the current models, I'll get access again.
I've also had similar issues in the past after outages due to IP conflicts on the WAN interface, so make sure you haven't hardcoded anything. It may also be worth trying to hook up your laptop directly to the modem (firewall turned on of course) and run those same tests.
bbrendon
Active Member
Make sure to set your Monitor IP address in pfsense. I wouldn't use any automated bandwidth tests. IMO those mostly waste bandwidth. They are useful for periodic troubleshooting.
Also, keeping traceroute logs can be helpful.
At work we keep 1 year history of packet loss data, latency, and traceroute logs that gets saved when a latency/packetloss alert is triggered.
Also, keeping traceroute logs can be helpful.
At work we keep 1 year history of packet loss data, latency, and traceroute logs that gets saved when a latency/packetloss alert is triggered.
Here's tracert - first line is just my pfsense router. Comments?
I tried to run streaming media test on dslreports. Even on the 720 youtube it never got past buffering.
Tried the line quality ping test but it said my IP wasn't pingable. I think I could turn that on temporarily in pfsense.
Speed test shows 90 Mbps. (on another site - I didn't want to install browser plug in.)
Jitter/ping test was A+
pete_c
Guru
Here is the same here near Chicago. Note the bold ms times.
Tried the line quality ping test but it said my IP wasn't pingable. I think I could turn that on temporarily in pfsense.
Yes via the firewall rules.
The above could be issues beyond your control and more related to Spectrum ISP. (well like their infrastructure).
Code:
2  po-318-327-rur201.homewood.il.chicago.comcast.net (96.216.26.77)  9.437 ms  17.902 ms  11.022 ms
 3  24.153.88.14 (24.153.88.14)  11.577 ms  11.591 ms  10.494 ms
 4  96.216.209.1 (96.216.209.1)  11.004 ms  9.567 ms  9.864 ms
 5  * * *
 6  96.216.150.114 (96.216.150.114)  14.161 ms  13.586 ms  15.307 ms
 7  * be-32221-cs22.350ecermak.il.ibone.comcast.net (96.110.40.53)  17.287 ms  15.722 ms
 8  be-2211-pe11.350ecermak.il.ibone.comcast.net (96.110.33.198)  9.948 ms  14.100 ms  10.172 ms
 9  173.167.59.234 (173.167.59.234)  18.038 ms  17.872 ms  11.900 ms
10  ae12.r01.ord01.icn.netarch.akamai.com (23.207.231.34)  13.703 ms *  11.943 ms
11  ae3.r02.msp01.icn.netarch.akamai.com (23.32.63.117)  23.745 ms  24.682 ms  28.134 ms
12  ae2.r01.msp01.ien.netarch.akamai.com (23.207.228.37)  25.427 ms  21.167 ms  20.357 ms
13  ae1.cologix-msp5.netarch.akamai.com (23.207.228.131)  27.333 ms  26.045 ms  33.234 ms
14  a184-85-255-156.deploy.static.akamaitechnologies.com (184.85.255.156)  19.920 ms  19.374 ms  20.144 ms
Tried the line quality ping test but it said my IP wasn't pingable. I think I could turn that on temporarily in pfsense.
Yes via the firewall rules.
The above could be issues beyond your control and more related to Spectrum ISP. (well like their infrastructure).
Last edited:
Pete, I don't see anything in bold in your tracert block?
Spectrum was out and said there were issues with the signal level (too high) and the signal from the modem back to spectrum. They said a F connector between cables was the issue. It was one I had and used to take their attenuator out of the circuit when a trouble call said take the attenuator ouf of circuit because they oftne cause problems. In retrospect that recommendation seems like a wild guess not based on actually looking at signal levels. Today they installed a 4 way splitter to cut the signal to half of what the earlier 2 way splitter did and showed me that the signal was right in the middle of the low and high limits. I have no immediate way to tell if it's any better as the tests I have been running look the same. I guess time will tell.
Spectrum was out and said there were issues with the signal level (too high) and the signal from the modem back to spectrum. They said a F connector between cables was the issue. It was one I had and used to take their attenuator out of the circuit when a trouble call said take the attenuator ouf of circuit because they oftne cause problems. In retrospect that recommendation seems like a wild guess not based on actually looking at signal levels. Today they installed a 4 way splitter to cut the signal to half of what the earlier 2 way splitter did and showed me that the signal was right in the middle of the low and high limits. I have no immediate way to tell if it's any better as the tests I have been running look the same. I guess time will tell.
pete_c
Guru
Yes I do not see it either...that said it was showing response time to be 19ms compared to your 46ms.
XFinity here put a splitter / attenuator on my line; then removed it. I could see the difference in the modem diagnostic page.
That said the modem does self adjustments anyhow for optimal signals.
Here when I complained about the increase in RTT after some infrastructure work nearby they did send a technician to check modem signals and cable to the back yard box. All was well. Tech mentioned that sometimes when they "improve" infrastructure it does the opposite as it did for me. Weeks later here now see RTT times back to what they were before infrastructure changes. Technician mentioned congestion and routing issues on the XFinity side could cause my issues.
If you can keep the ticket open until you see an improvement in your transport.
I suspect that the signal level goes down during wet weather but that's just a guess. The ticket is closed. I did get a request for feedback on the call and am thinking I will wait a few days to see how things go. I am still seeing several 40-50 mS hops in the tracert. I also notice that hop 2 frequently times out. I am thinking that might be something to do with my setup here.
From what I have read tracert uses ICMP packets that some sites do not respond to and the second hope is from the pfsense box to spectrum. If so I don't see how to change that.
I do have DNS resolver selected. I don't any place I have set DNS servers and have DHCP selected for the WAN port of pfsense.
Here's a tracert to weather.com this morning:
I do have DNS resolver selected. I don't any place I have set DNS servers and have DHCP selected for the WAN port of pfsense.
Here's a tracert to weather.com this morning:
Code:
  2     *        *        *     Request timed out.
  3    11 ms     7 ms     8 ms  lag-63-10.dtr01rxnail.netops.charter.com [96.34.52.128]
  4     8 ms    10 ms     8 ms  lag-10.crr02blvlil.netops.charter.com [96.34.50.97]
  5     9 ms     9 ms    10 ms  lag-310.crr01blvlil.netops.charter.com [96.34.49.222]
  6    15 ms    10 ms    10 ms  lag-200.crr02olvemo.netops.charter.com [96.34.76.176]
  7    10 ms    11 ms    14 ms  lag-310.crr01olvemo.netops.charter.com [96.34.52.22]
  8    15 ms    12 ms    15 ms  lag-807.bbr01olvemo.netops.charter.com [96.34.2.164]
  9    16 ms    16 ms    15 ms  lag-2.bbr02chcgil.netops.charter.com [96.34.0.12]
 10    15 ms    17 ms    16 ms  lag-802.prr01chcgil.netops.charter.com [96.34.3.11]
 11    90 ms    16 ms    18 ms  096-034-152-019.biz.spectrum.com [96.34.152.19]
 12     *        *        *     Request timed out.
 13     *        *        *     Request timed out.
 14     *        *        *     Request timed out.
 15    14 ms    14 ms    18 ms  a23-60-79-91.deploy.static.akamaitechnologies.com [23.60.79.91]

Trace complete.